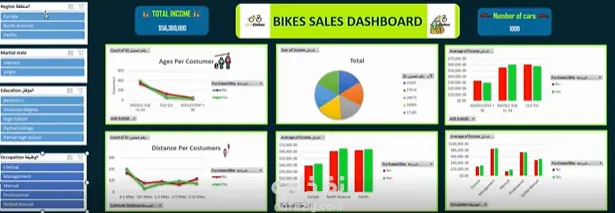
fully interactive Bike Sales Dashboard
تفاصيل العمل
As a part of Digital Egypt Pioneers Initiative - DEPI 🔍 What I Built: ✅ Total Income & Sales KPIs $55.38 million in total bike sales revenue 1,000 total customers analyzed ✅ Region-Based Filtering View and compare sales from Europe, North America, and the Pacific ✅ Customer Profile Filters Marital Status, Education Level, and Occupation Category filters to explore specific segments See how these demographics impact purchasing behavior ✅ Visual Analysis Sections 📌 Age Per Customer Age groups (Adolescent, Middle Age, Old) visualized with income breakdown Purchased vs Not Purchased comparison 📌 Distance Per Customer Analyzed how far customers are willing to travel to buy a bike Sales trends grouped by distance ranges (0–1 mile, 1–5 miles, etc.) 📌 Average Income by Segment Detailed income comparison by Age Group, Region, and Occupation Highlighting key income contributors and underserved segments 📌 Pie Chart Summary Quick visual breakdown of overall income by customer group All visuals are dynamic. 🛠️ Tools Used: Excel (with pivot charts & slicers) 💡 Focus Areas: Data Visualization | Customer Behavior | Sales Intelligence | Dashboard Design
مهارات العمل
بطاقة العمل

طلب عمل مماثل


