Sales Dashboard
تفاصيل العمل
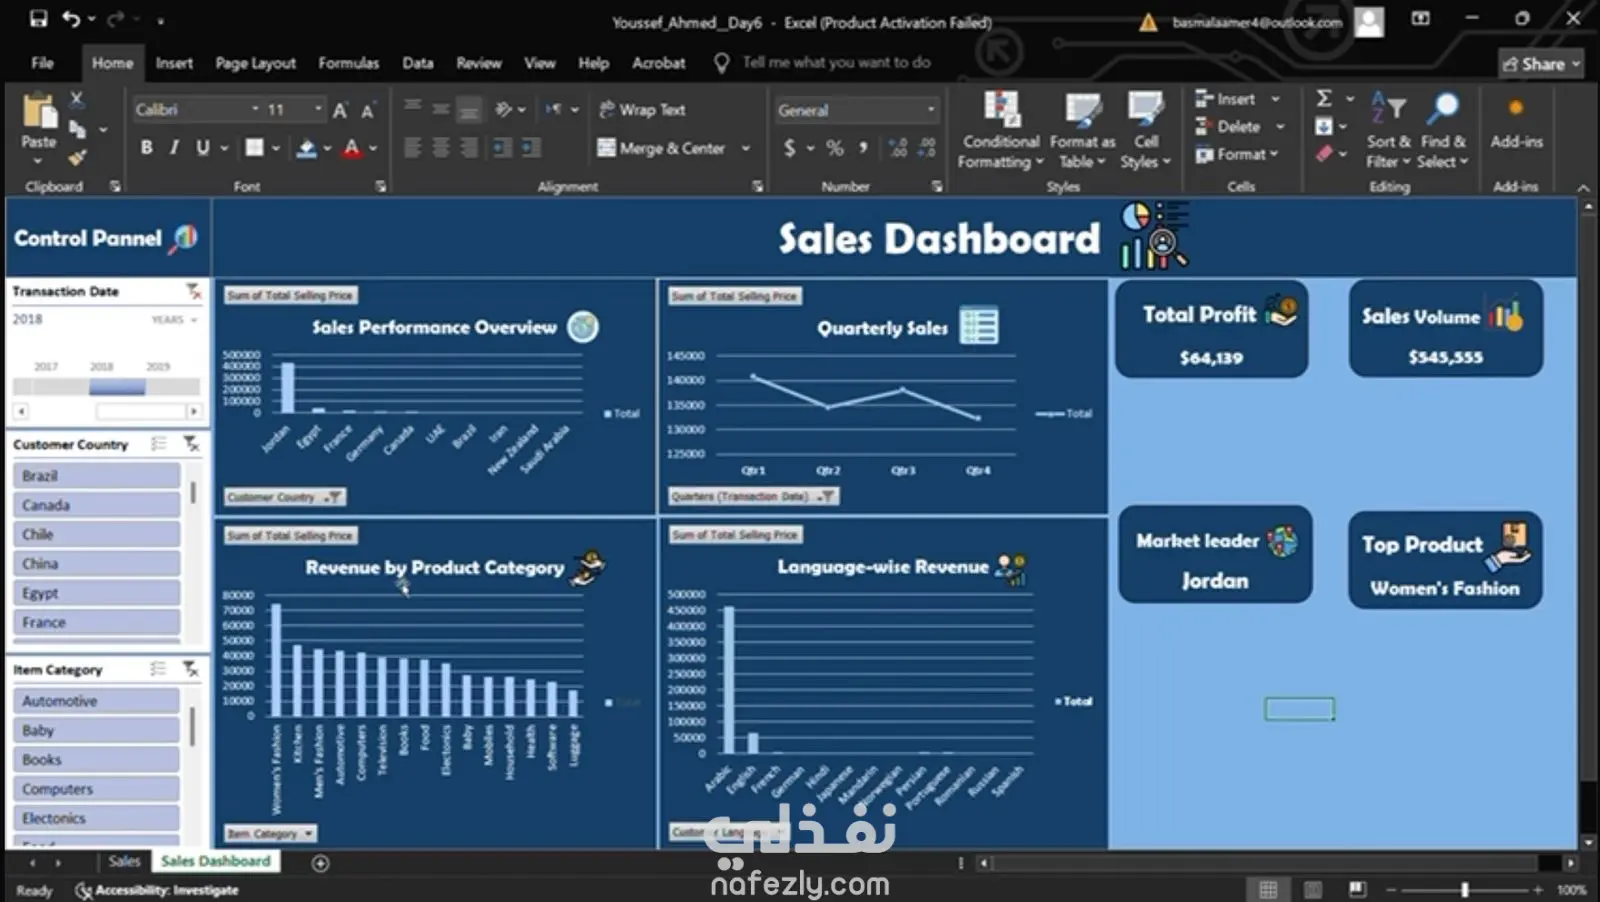
As part of the Digital Egypt Pioneers Initiative (DEPI), I built my very first interactive sales dashboard in Excel and I can’t put into words how proud and motivated I feel right now. What started as raw data has now turned into a clear, dynamic tool that tells the story behind the numbers. This project wasn’t just about charts it was about learning, experimenting, and pushing myself to create something both functional and visually engaging. ✅ What I Used: Pivot Tables & Pivot Charts for powerful analysis Slicers & Timelines for smooth, dynamic filtering KPI cards for quick, high-impact insights (Total Sales, Profit, Top Country) Clean, professional design to make data easy to digest ✅ What I Learned: How to transform data into actionable insights The importance of design in analytics Linking tools like slicers, KPIs, and pivot tables to create an interactive experience This is just the first step and I’m absolutely thriving for more💡 Next stop: diving deeper into data visualization with Power BI and Tableau, building dashboards that go beyond numbers to inspire decisions. The journey has only begun and I’m ready for the next challenge. 🙏
مهارات العمل


