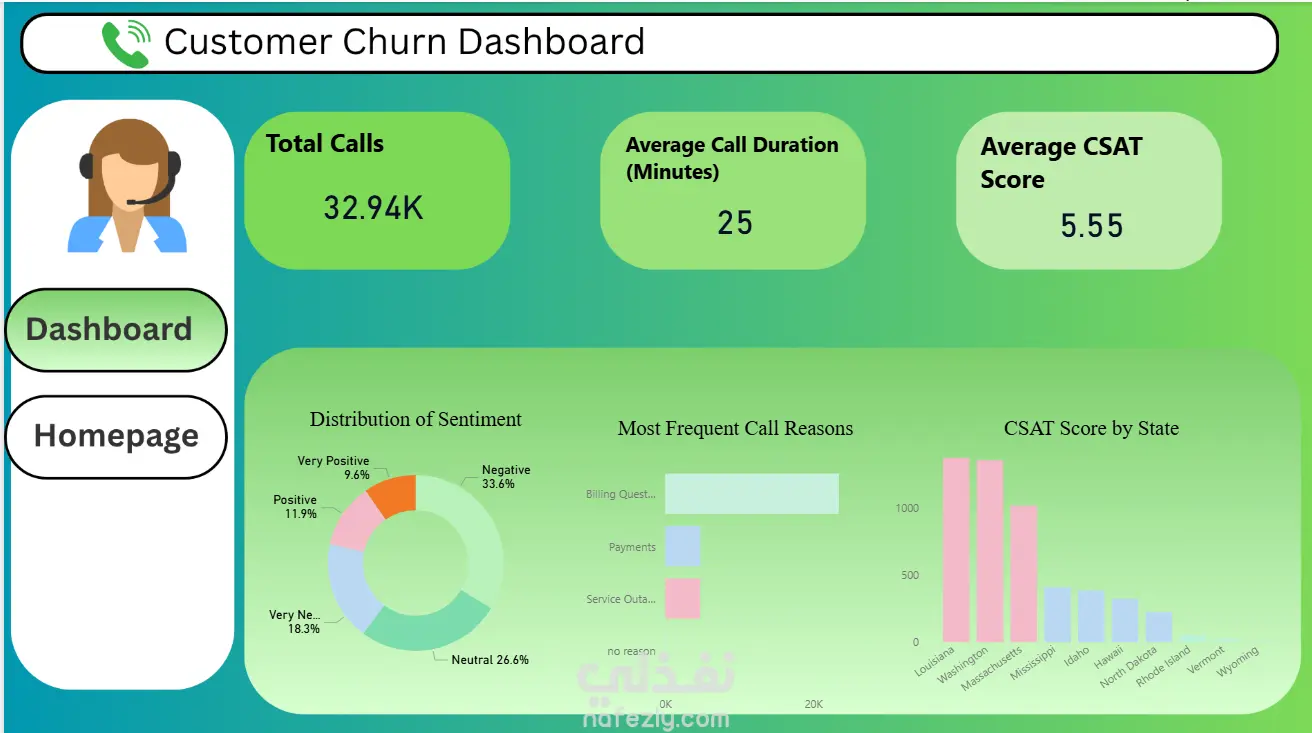
I've developed a comprehensive Call Center Dashboard that transforms raw operational data into actionable insights for management teams.
🎯 Key Features:
✅ Real-time Performance Metrics - Monitor call volumes, response times, and agent productivity ✅ Customer Satisfaction Analytics - Track CSAT scores and identify improvement opportunities
✅ Agent Performance Tracking - Individual and team-based KPI monitoring ✅ Interactive Visualizations - Dynamic charts and filters for deep-dive analysis ✅ Trend Analysis - Historical data patterns and forecasting capabilities
💡 Business Impact:
Reduced average response time by identifying peak hour patterns
Enhanced resource allocation through data-driven insights
Improved customer satisfaction tracking and reporting
Streamlined management decision-making process
🛠️ Technical Stack:
Built using modern data visualization tools with focus on user experience and performance optimization.
This project demonstrates how effective data visualization can transform operational efficiency in customer service environments.