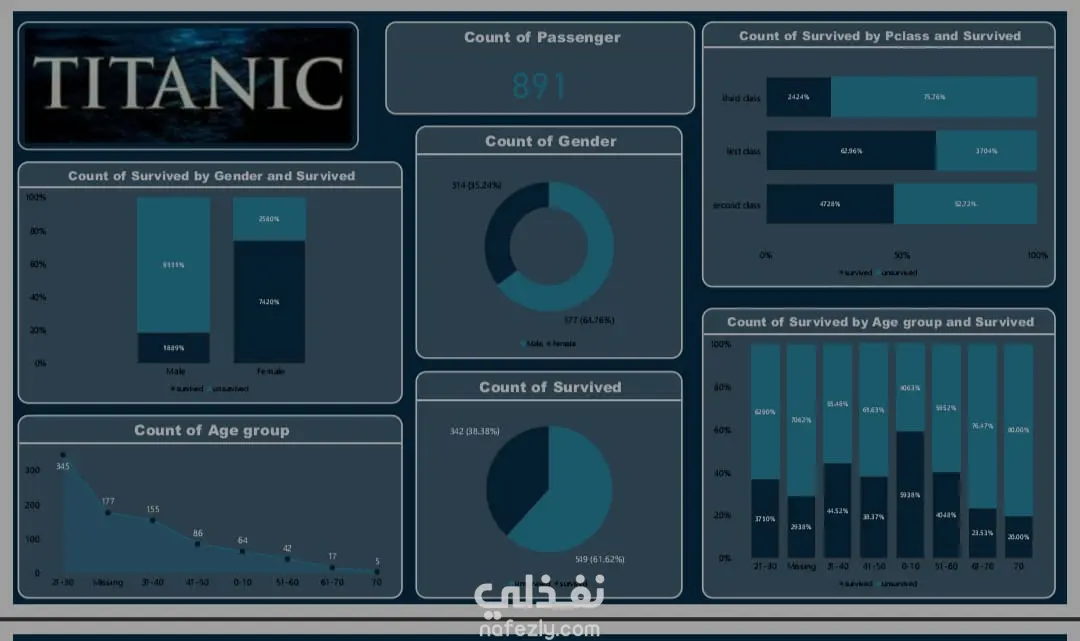
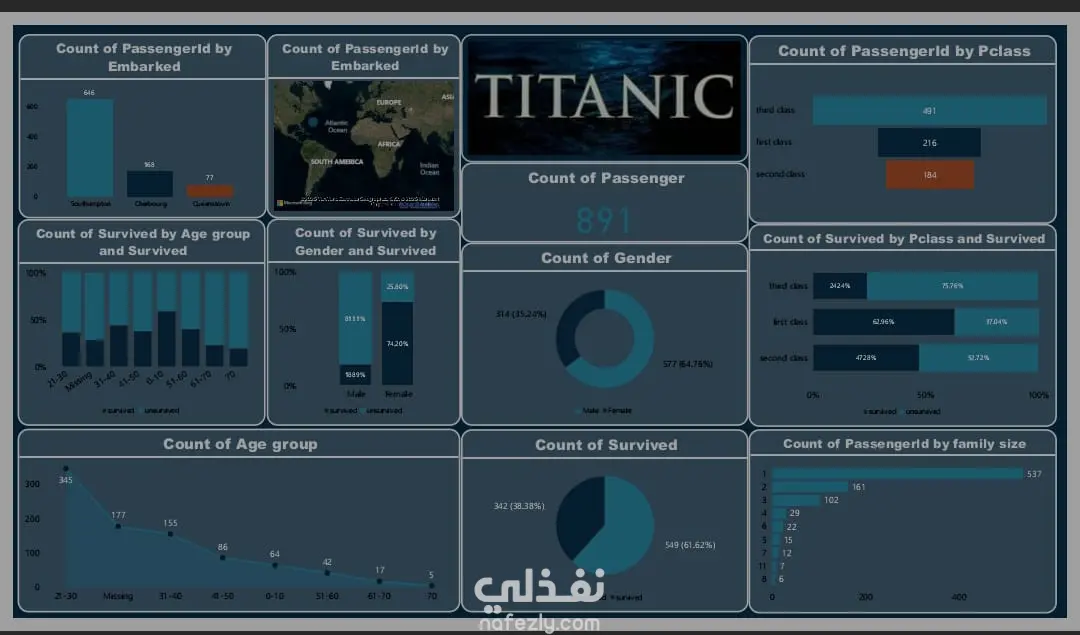
I created this dashboard to analyze key insights from the Titanic dataset, showcasing survival patterns based on gender, age group, class, port of embarkation, and family size.
Built with data visualization tools -power BI- to draw actionable insights from historical data blending storytelling with statistics.