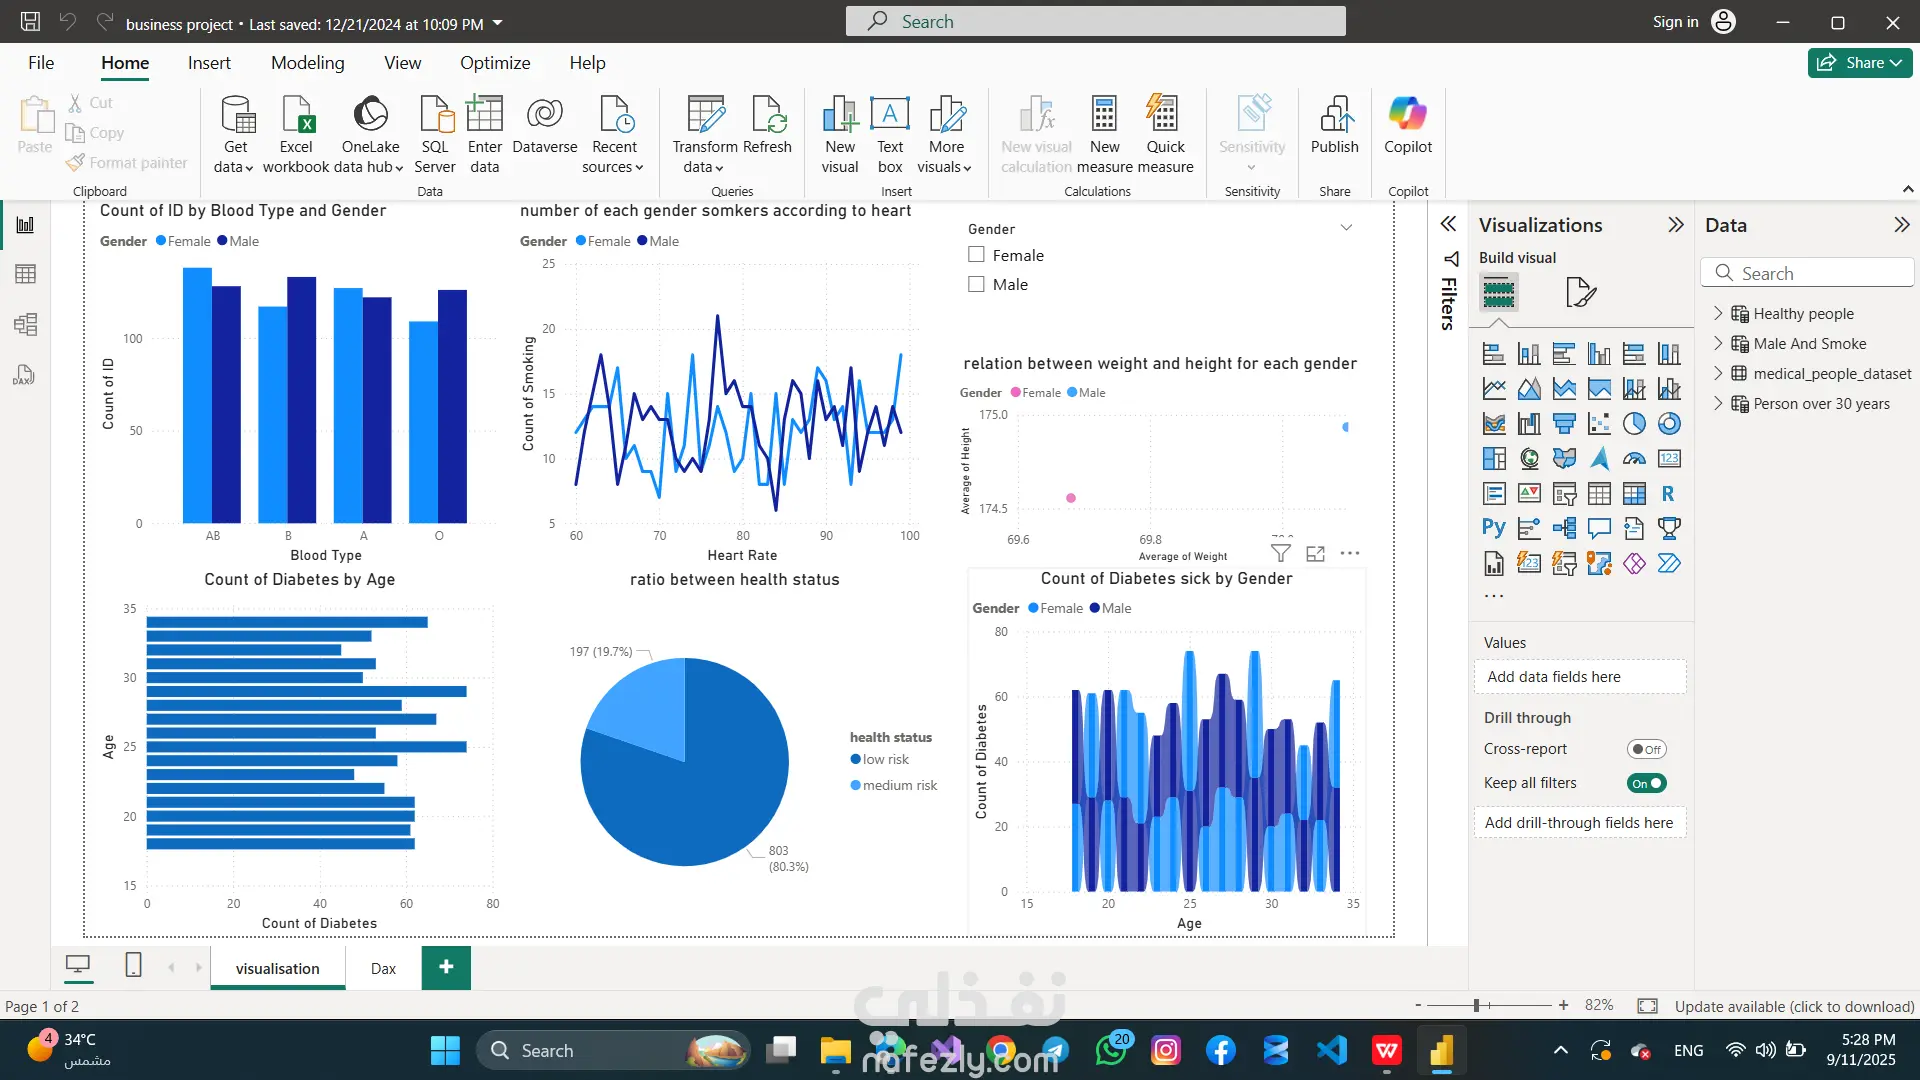
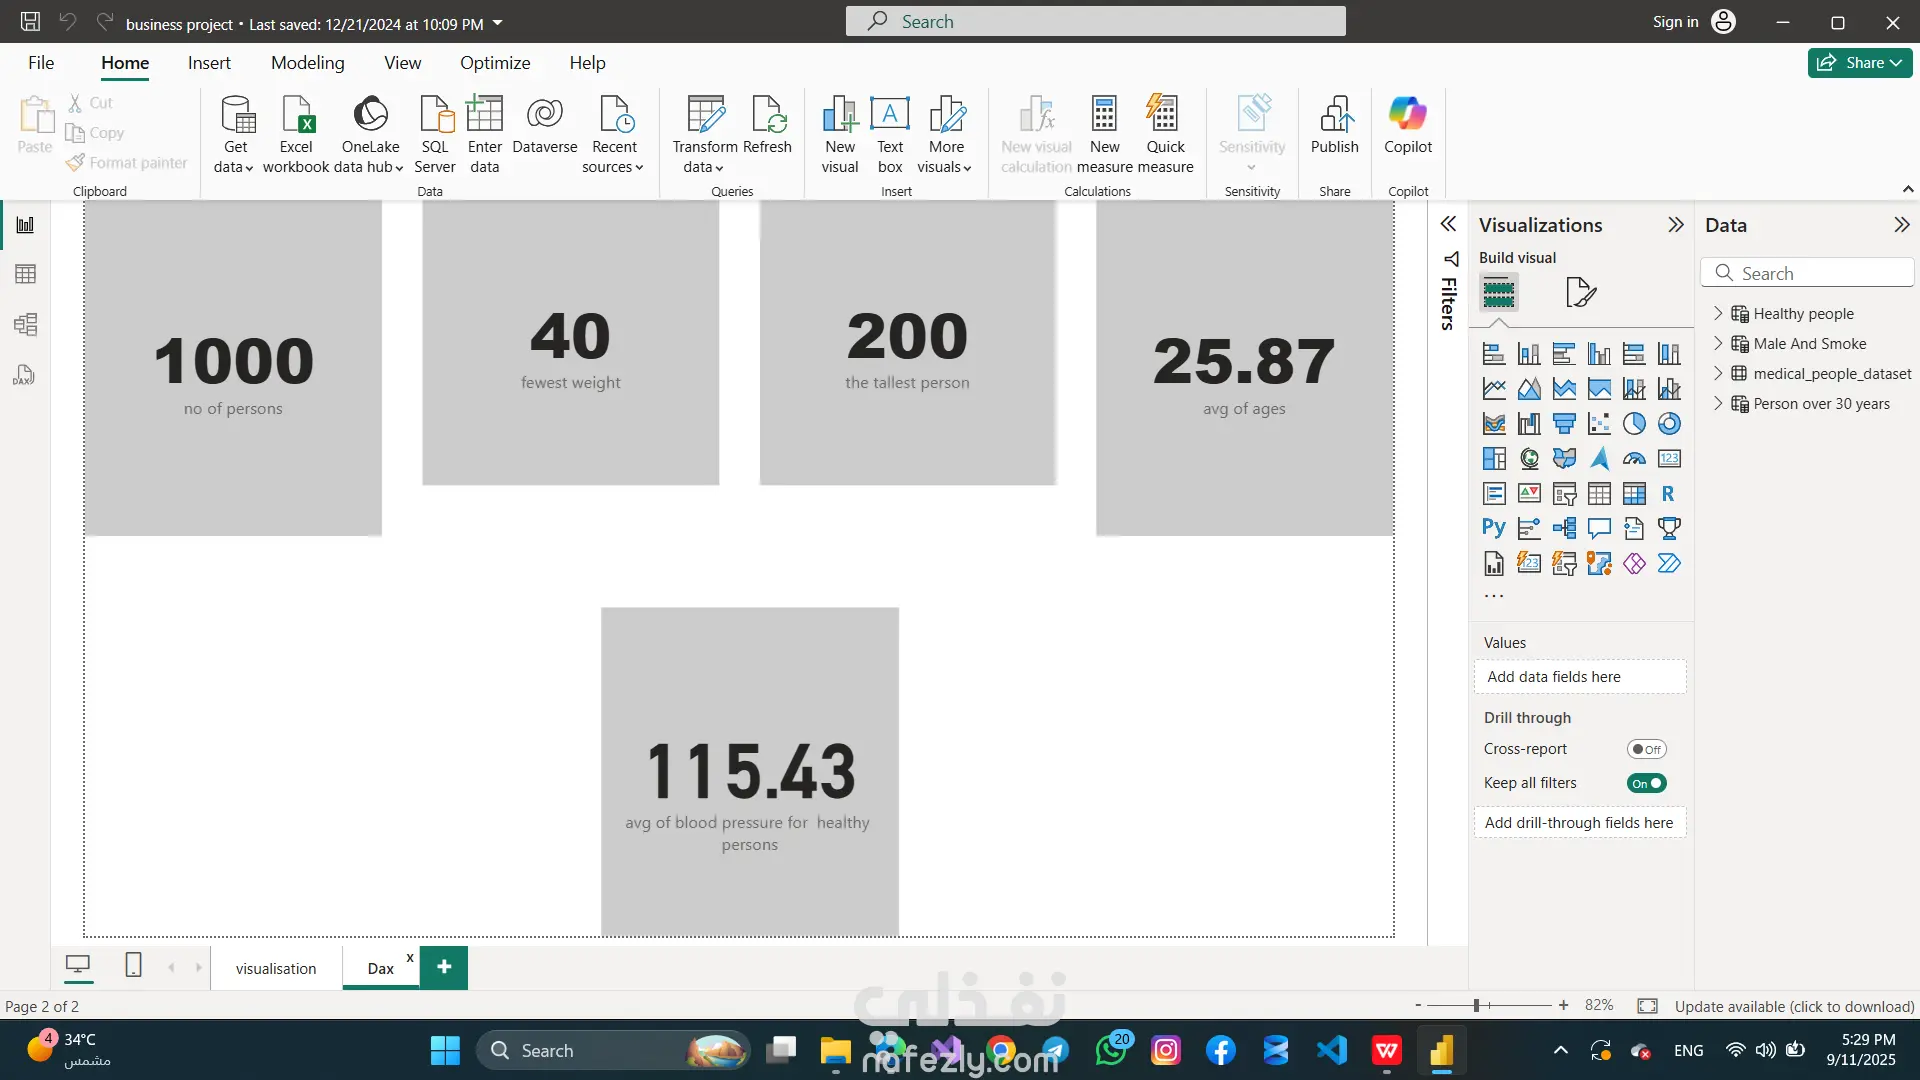
Developed an interactive business dashboard using Power BI to analyze and visualize key performance indicators.
Used data modeling techniques and DAX expressions to create dynamic charts, filters, and reports.
The project helped identify trends and insights from raw data to support decision-making.
Focused on clean design, usability, and real-time filtering features.