In this project, I created an interactive dashboard using Power BI to analyze the Titanic dataset.
The dashboard highlights:
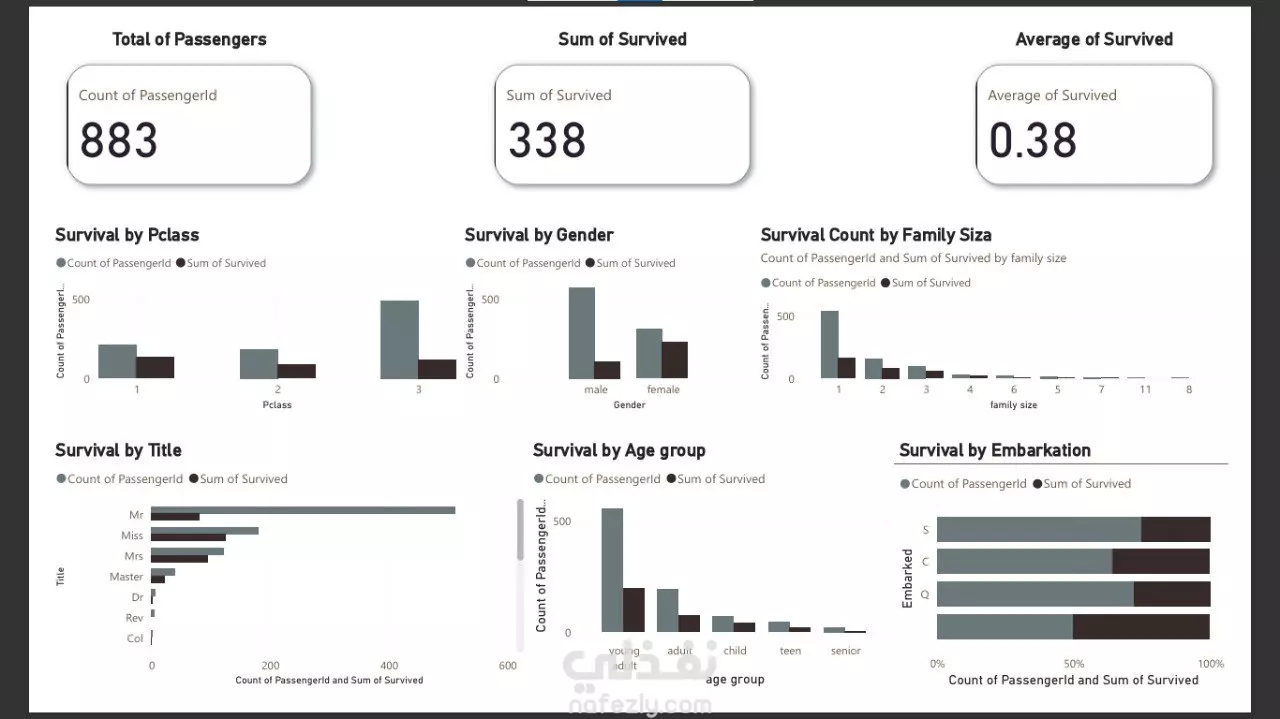
Total passengers, total survivors, and survival rate.
Survival analysis by class (Pclass), gender, and family size.
Insights by title, age group, and embarkation point.
The goal of this project is to demonstrate how data visualization can reveal patterns and insights to support better decision-making.
Tools Used:
Power BI
Titanic Dataset