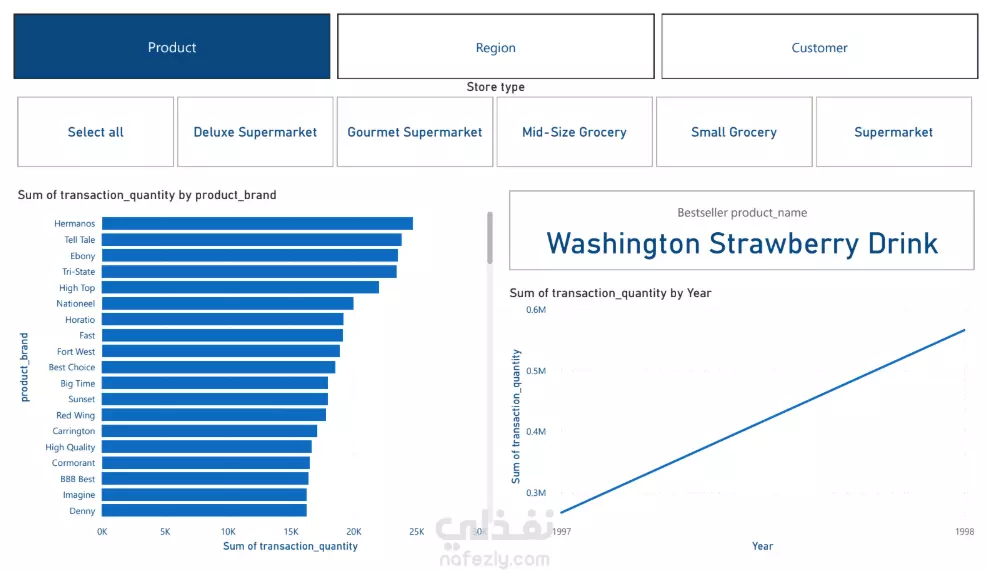
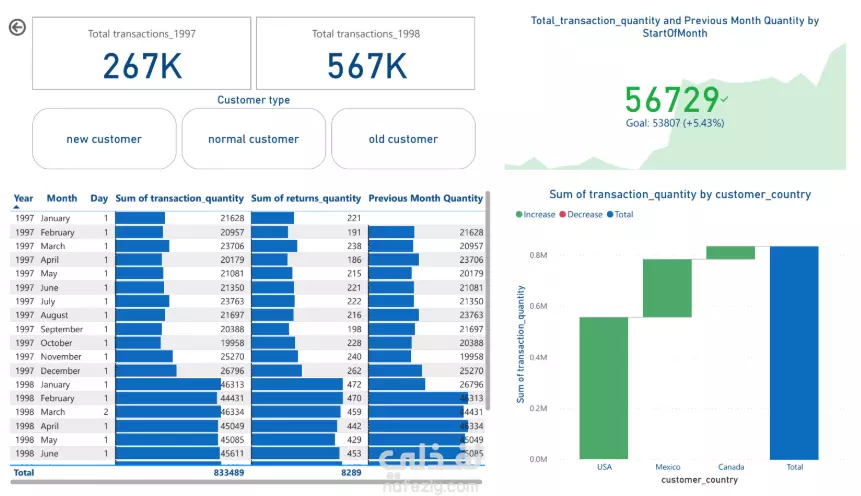
Interactive Sales Dashboard

تفاصيل العمل
A Power BI Sales Analysis Project analyzing transactional data from 1997 to 1998 to assess sales performance across store types and regions in North America. Period: 1997–1998 Tools: Power BI Desktop, DAX, Data Modeling Project Highlights Performed comprehensive sales and returns analysis across USA, Canada, and Mexico. Cleaned and transformed raw transactional data to build a star schema with: 1 Fact Table: Sales 4 Dimension Tables: Products, Customers, Regions, Store Types Built a 3-page interactive Power BI dashboard including: Slicers Drill-through pages Tooltips Navigation buttons Bookmarks Used DAX for dynamic calculations: Time intelligence: SAMEPERIODLASTYEAR, PREVIOUSMONTH, etc. Custom KPIs for year-over-year trends and monthly comparisons Identified: Top-performing products, brands, and store types Regional performance across countries and cities Delivered insights into customer behavior: New vs. returning customers Return rates Strategic recommendations based on trends
مهارات العمل
بطاقة العمل

طلب عمل مماثل


