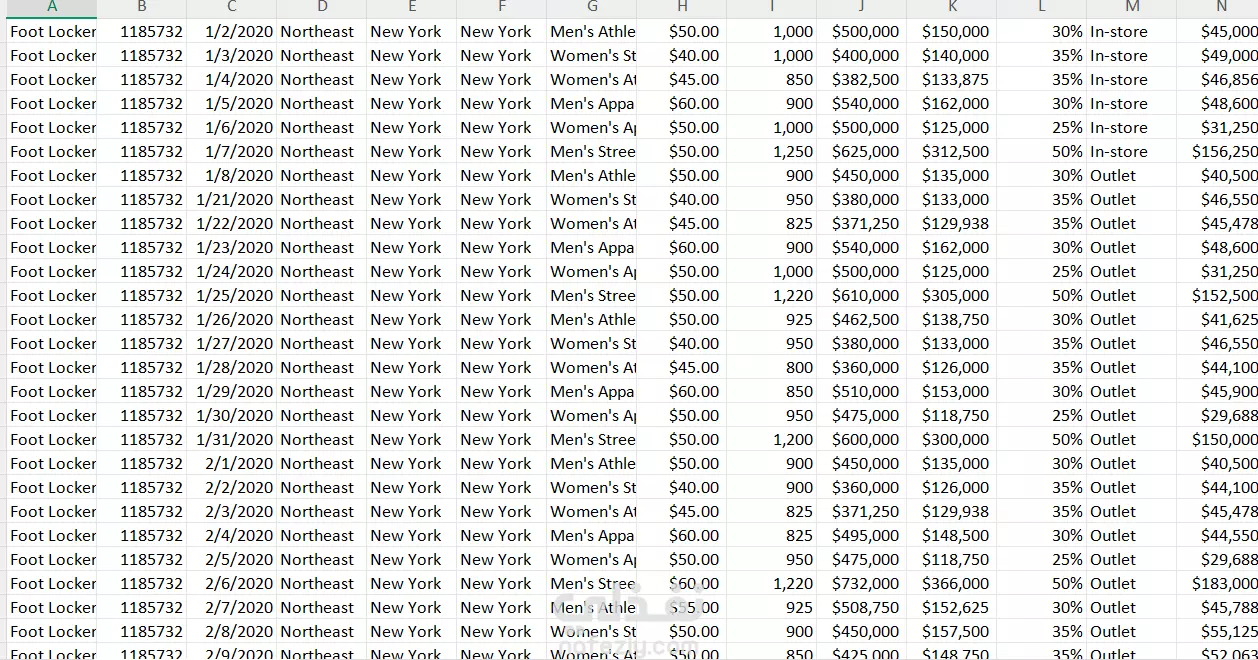
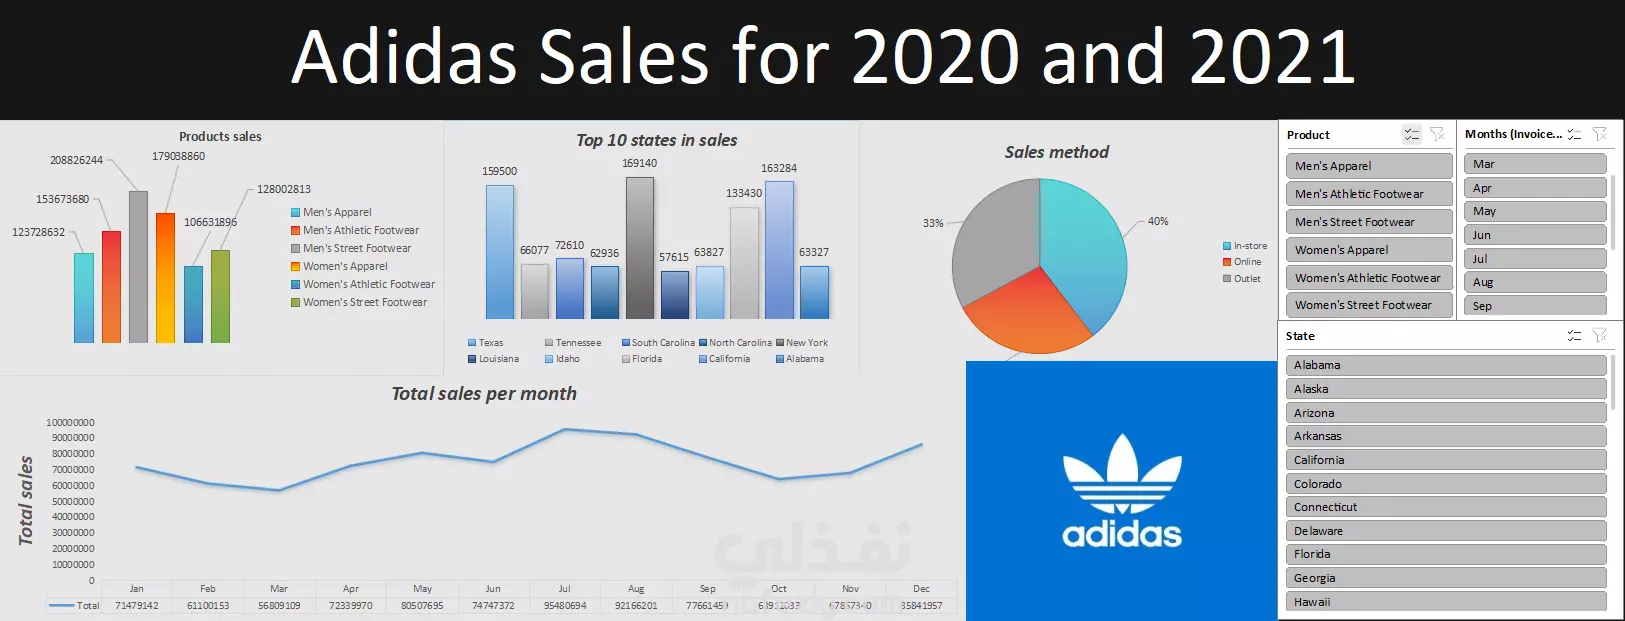
A comprehensive dashboard built using Microsoft Excel to visualize Adidas sales data from 2020 and 2021.
It includes:
Total sales per month
Top 10 states by revenue
Product category performance
Sales method breakdown (In-store, Online, Outlet)
Interactive filters for product, state, and month
This project showcases my skills in data cleaning, pivot tables, slicers, and dashboard design.