مشروع Power BI: لوحة تحكم أداء الموظفين
تفاصيل العمل
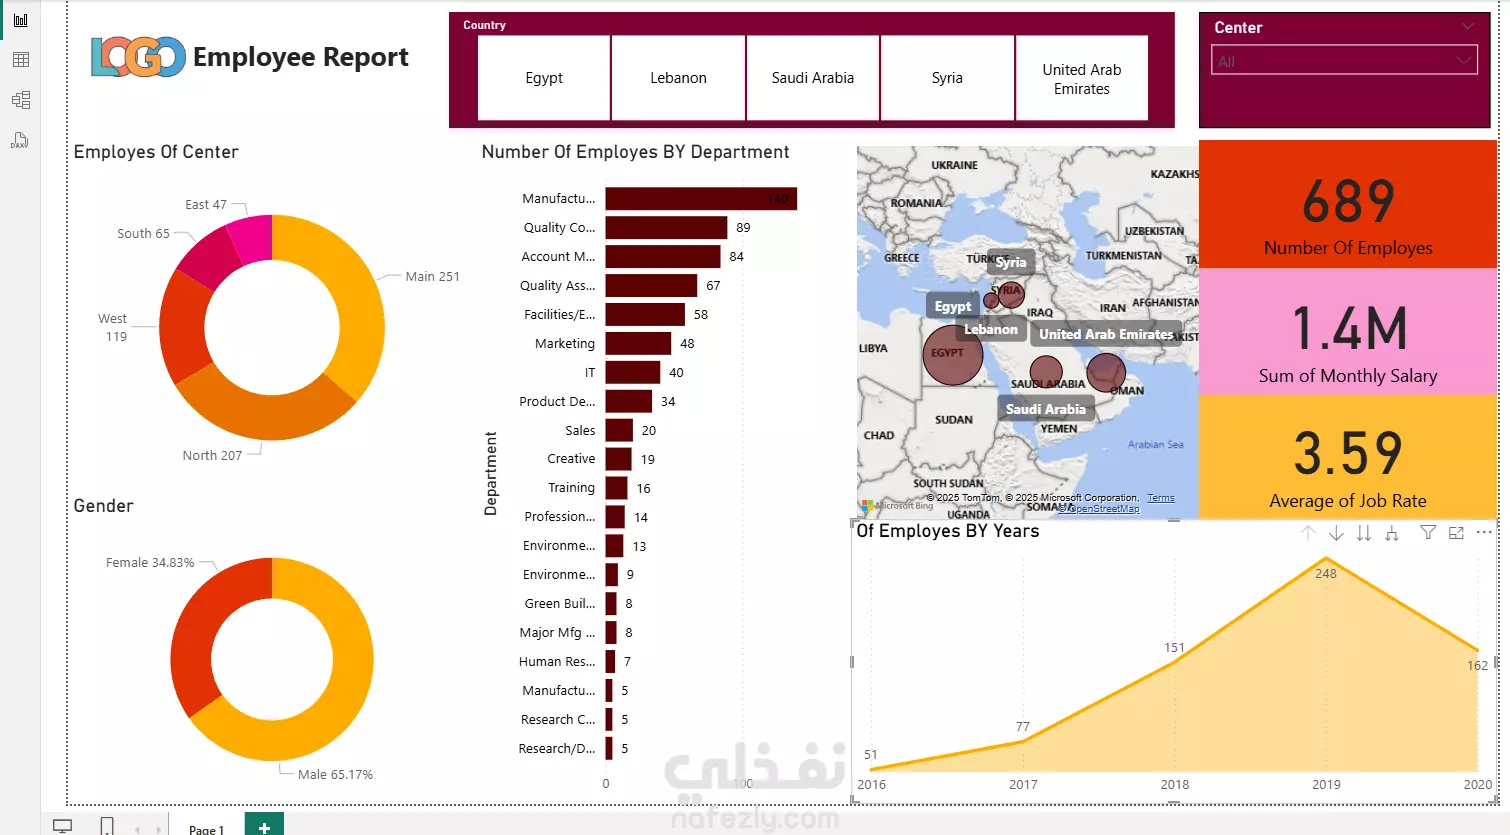
مشروع Power BI: لوحة تحكم أداء الموظفين تحليل تفاعلي واحترافي لبيانات الموظفين سعيد جدًا بمشاركة أحدث مشاريعي باستخدام Power BI، وهو Dashboard ديناميكي مصمم لتحليل بيانات الموظفين ودعم اتخاذ القرارات التي تساعد على زيادة الإنتاجية. نظرة عامة على المشروع: اسم المشروع: لوحة تقارير الموظفين (Employee Report Dashboard) المجال: تحليلات الموارد البشرية (HR Analytics) ️ الأدوات المستخدمة: Power BI Desktop النمذجة البيانية للبيانات (Data Modeling) صيغ DAX Power Query ماذا يقدم التقرير؟ إحصاءات عامة عن الموظفين تقسيم الموظفين حسب الأقسام، الأدوار الوظيفية، وتقييمات الأداء مقارنة سهلة بين أداء الأقسام المختلفة مساعدة الإدارة في تتبع أداء الموظفين، الحضور، والإنتاجية أهداف المشروع: توفير تحليلات ذكية تدعم قرارات التوظيف، التدريب، والترقيات تحويل البيانات الخام إلى رؤى واضحة وقابلة للتنفيذ باستخدام Power BI إنشاء لوحة تحكم تفاعلية سهلة الاستخدام لمديري الموارد البشرية ومتخذي القرار المهارات المطبقة: تصميم لوحة تحكم احترافية إنشاء العلاقات بين جداول البيانات التحليل المرئي باستخدام الرسوم البيانية والعناصر البصرية إنشاء مؤشرات الأداء الرئيسية (KPIs) تنظيف وتحويل البيانات باستخدام Power Query كتابة صيغ DAX مخصصة للحصول على تحليلات أعمق
بطاقة العمل

طلب عمل مماثل