Here's a quick snapshot of Bikes sales performance:
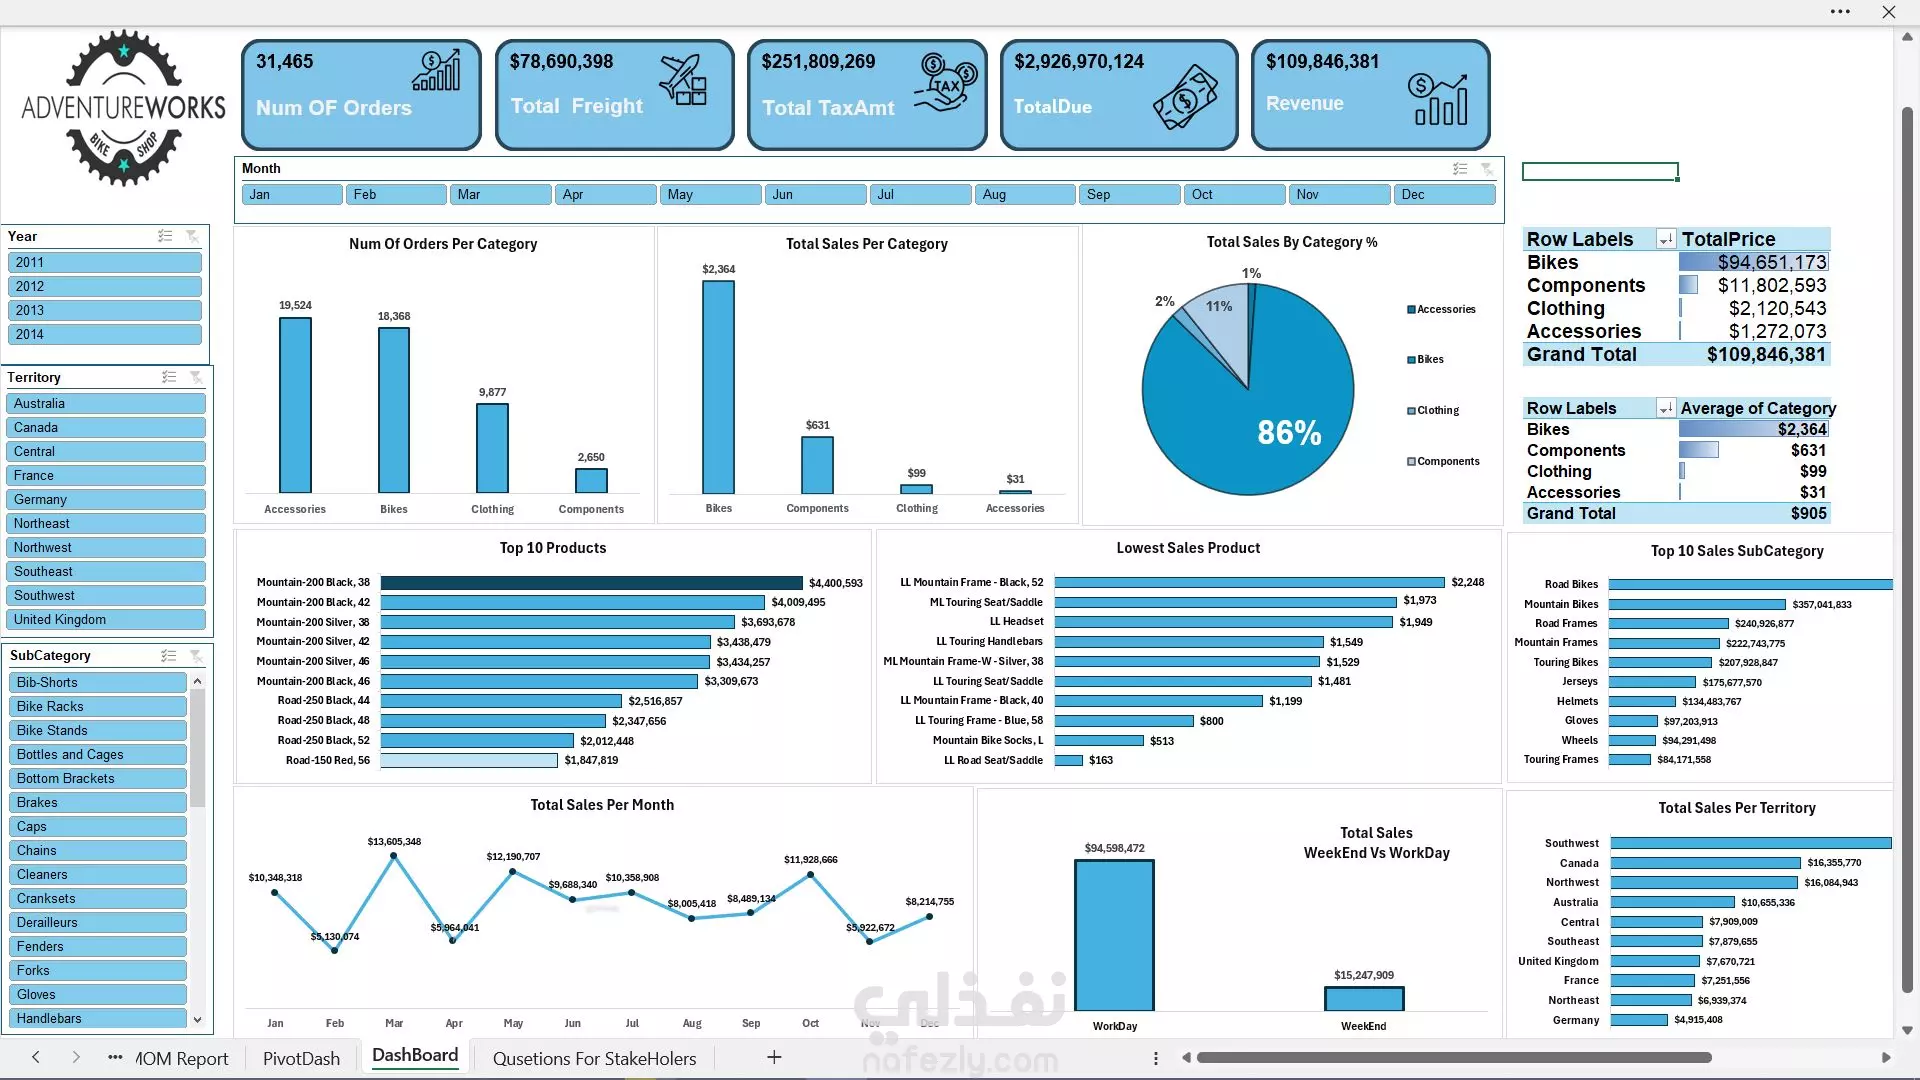
✅ 31,465 total orders
✅ $109.8M in total revenue
✅ $2.93B in total dues
✅ $251.8M in total tax amount
✅ $78.7M in total freight
📦 Top Product Category:
· Bikes lead with $94.6M in sales – that's 86% of total revenue!
📉 Lowest Sales Product:
· Road Seat/Saddle with only $163 in sales
🌍 Top Performing Territory:
· Southwest with $24.2M in sales
📅 Best Sales Month:
· March with $13.6M
🧠 Insights Gained:
· High reliance on bike sales indicates strong demand but also a potential risk if not diversified.
· Weekend vs Workday sales highlight more revenue on Workdays ($94M vs $15.2M), supporting strategic planning for staffing and promotions.
This dashboard empowers decision-makers to target growth opportunities and optimize operations. 📊
🔧 Tools used:
Excel, Power Qu